Introduction
In the past, you may have represented linear relationships using different forms, including equations, graphs, tables, and verbal situations.
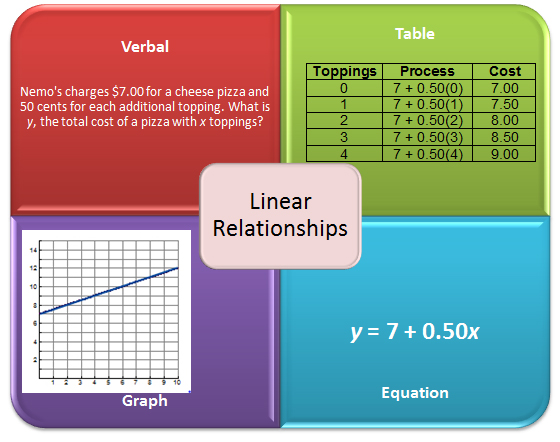
In this lesson, you will focus on generating a graph when you are given the linear equation. You will graph two linear equations at the same time and look for patterns in the graphs.
Graphing Lines in Slope-Intercept Form
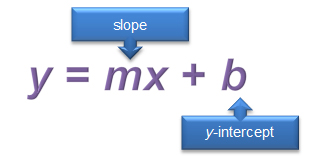
In this section, you will review how to graph lines in slope-intercept form. Recall that slope-intercept form of a linear equation is an equation in which the constants m and b represent the slope and y-coordinate of the y-intercept, respectively.
Use the interactive below to investigate how to graph a line when the equation is in slope-intercept form. As you do, notice how the red points change. Also, notice how the vertical and horizontal distances change.
Use the interactive to answer the questions below.
- How does the y-coordinate of the y-intercept compare to the value of b?
- Look at the middle red point. How do the coordinates of this point compare to the slope, m, and the y-intercept?
- Look at the right-hand red point. How do the coordinates of this point relate to the slope, m, and the coordinates of the middle red point?
Graphing Lines in Slope-Intercept Form
Use the sliders to adjust the values of m and b for a line that is graphed in y = mx + b, or slope-intercept, form.
OnTRACK for College Readiness, Created with GeoGebra
Pause and Reflect
- The y-intercept of a line is sometimes called the starting point. When graphing a line whose equation is given in slope-intercept form, why do you think that is the case?
- Once you have the y-intercept plotted, how can you use the slope to obtain additional points?
Practice
Graph each of the following lines. Use an online graphing utility or graph paper and a pencil.
Interpreting Intersections of Lines
In the last section, you reviewed how to graph lines when you were given the equation in slope-intercept form. In this section, you will graph two intersecting lines at the same time, and then look for patterns with the point of intersection.
Use the interactive below to graph the two linear equations shown. Use your graph to answer the questions that follow. Click to access the interactive.
y = 2x – 5
y = 1/2x + 1
Use the interactive to answer the questions below.
- What are the coordinates of the point of intersection? What does this tell you about the x-value and y-value of this point?
- Substitute the x-value and y-value into the first equation and simplify the results. What does this tell you about the coordinates of the point?
- Substitute the x-value and y-value into the second equation and simplify the results. What does this tell you about the coordinates of the point?
- Do the coordinates of the point of intersection give you a solution to both equations? How do you know?
- Repeat this process using the interactive for the two equations, y = 0.4x + 3 and y = −x + 6.5. What do the coordinates of the point of intersection of the graphs of the two lines tell you about the solutions?
Pause and Reflect
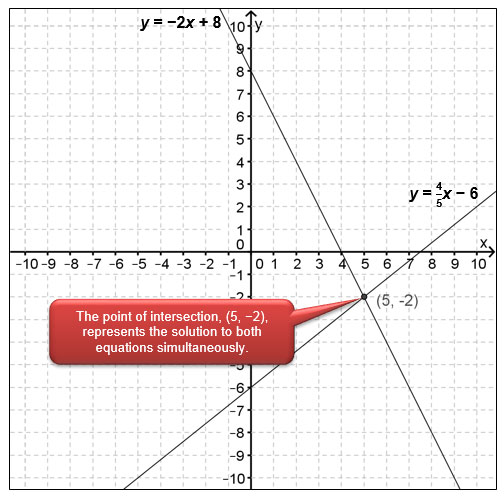
When you graph two equations at the same time, the two equations are called simultaneous equations. How can you identify from the graph the solution to two simultaneous equations?
Practice
For each of the following pairs of simultaneous equations, graph the two equations. Then, use the graphs to determine the values of x and y that satisfy both equations at the same time.
Summary
In this lesson, you applied what you had previously learned about graphing linear equations in slope-intercept form to simultaneous linear equations.
When two linear equations are graphed together, they may or may not intersect. (Sometimes, they are parallel!) If they do intersect, then the point of intersection describes the values of x and y that satisfy both equations at the same time. The coordinates of the point of intersection represent the solution to both linear equations simultaneously.