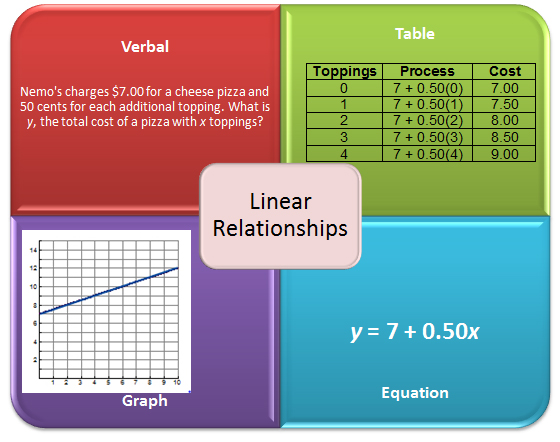
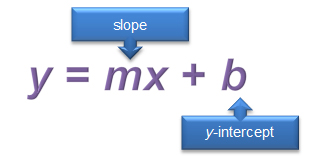
In this section, you will review how to graph lines in slope-intercept form. Recall that slope-intercept form of a linear equation is an equation in which the constants m and b represent the slope and y-coordinate of the y-intercept, respectively.
Use the interactive below to investigate how to graph a line when the equation is in slope-intercept form. As you do, notice how the red points change. Also, notice how the vertical and horizontal distances change.
Use the interactive to answer the questions below.
- How does the y-coordinate of the y-intercept compare to the value of b?
- Look at the middle red point. How do the coordinates of this point compare to the slope, m, and the y-intercept?
- Look at the right-hand red point. How do the coordinates of this point relate to the slope, m, and the coordinates of the middle red point?