Let's Get Started
You will learn to represent functions in different forms and use your graphing calculator to find equations that match different graphs.
TEKS Standards and Student Expectations
A(2) Linear functions, equations, and inequalities. The student applies the mathematical process standards when using properties of linear functions to write and represent in multiple ways, with and without technology, linear equations, inequalities, and systems of equations. The student is expected to:
A(2)(C) write linear equations in two variables given a table of values, a graph, and a verbal description
A(7) Quadratic functions and equations. The student applies the mathematical process standards when using graphs of quadratic functions and their related transformations to represent in multiple ways and determine, with and without technology, the solutions to equations. The student is expected to:
A(7)(A) graph quadratic functions on the coordinate plane and use the graph to identify key attributes, if possible, including x-intercept, y-intercept, zeros, maximum value, minimum values, vertex, and the equation of the axis of symmetry
Resource Objective(s)
Given the graph of a linear or quadratic function, the student will write the symbolic representation of the function.
Essential Questions
What are the different forms of linear functions?
How can a graphing calculator be used to match a graph to a linear equation?
How is a quadratic equation different from a linear equation?
Vocabulary
Introduction
This table shows the three different ways to represent linear functions.
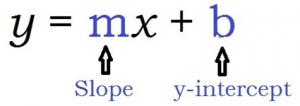
| slope-intercept form | y = mx + b |
| point-slope form | y – y1 = m(x – x1) |
| standard form | Ax – By = C |
Slope-Intercept Form
We’ll first look at slope-intercept form. Remember that the slope is the rise over the run (i.e., the change in y-value over the change in x-value.)
To review slope-intercept form, use this linked interactive activity. Move the sliders one at a time to change the slope (the y-intercept). After you have experimented with the activity, answer the questions below.
Using a Calculator with Slope-Intercept Form
Even the best mathematicians need ways to check their work. We’re going to use the graphing calculator to make sure we have the correct answer.
If you need a graphing calculator, you can use an online calculator here.
Example
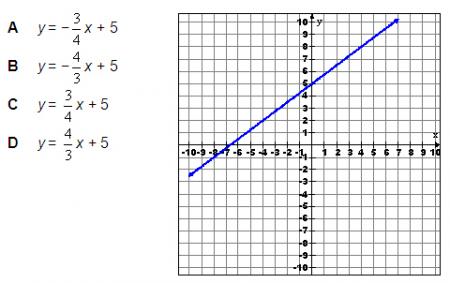
Which equation best describes the following graph?
If you are not sure of the answer, you can use your calculator three different ways to double check. You should learn all three methods because there will be times when one of the methods will not be obvious.
We will try option C: y = 3/4x + 5.
Method 1: Match the Graph
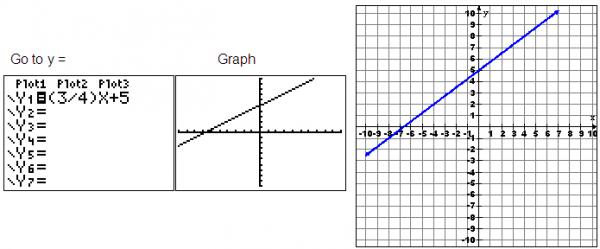
You can use your graphing calculator to look at a graph of an equation by following these steps:
- Go to Y=.
- Enter the equation.
- Graph the equation.
The graph on the calculator looks similar to the given graph, but we can’t be sure. We certainly can tell the line is increasing. Options A and B are definitely wrong because they have a negative slope.
Method 2: Match the Graph to the Table
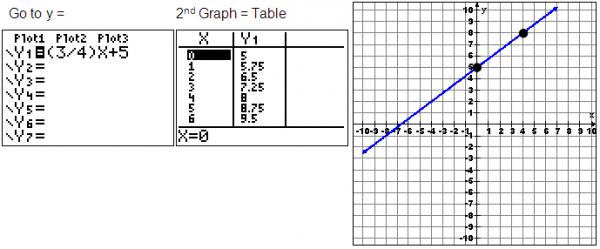
You can also use your graphing calculator to match the table of values from an equation by following these steps:
- Go to Y=.
- Enter the equation.
- Use 2nd Graph to view the table.
You can see that the two points (0, 5) and (4, 8) are on the line and in the table.
Method 3: Match Points on a Graph Using TRACE
You can also use the graphing calculator to find points on the line using the following steps:
- Go to Y=.
- Enter the equation.
- Graph the equation.
- Press the TRACE button and type x-values that are on the line.
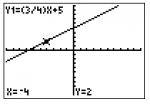
We can see that the point (-4, 2) is on the graph, so we'll use the TRACE button to find where x equals -4.
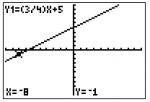
The point is on the line. Just to be sure, we will try another point at (-8, -1)
This point is also on the line. Now we know that option C is correct.
Standard Form Equations and Practice
What if the equation is not in slope-intercept form? This is a standard form equation.
Ax + By = C
You can manipulate the equation, so you can use the graphing calculator to check your answer.
Forms of Linear Equations
| slope-intercept form | y = mx + b |
| point-slope form | y – y1 = m(x – x1) |
| standard form | Ax – By = C |
To change a standard form equation to a slope-intercept form, you must isolate the variable y on the left side of the equation.
You can review the steps to change an equation from standard form to slope-intercept form in these 2 examples.
Example 1: Standard form to slope-intercept form.
Example 2: Standard form to slope-intercept form.
The following is a typical question you might see that has answer choices in standard form.
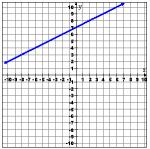
Which equation best describes the graph shown below?
Solving each equation for y, the equations are:
It seems that the right equation is option B.
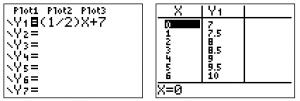
When we enter the equation in to the graphing calculator under Y=, we see the following results.
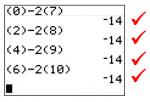
According to this, the points (0, 7), (2, 8) (4, 9) and (6, 10) should all be points on the graph. To check this, we substitute the x- and y-values from these points into x − 2y = −14.
We know B is correct!
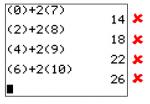
Here is how you know an answer is wrong:
Option D is incorrect because the points (0, 7), (2, 8) (4, 9) and (6, 10) will not satisfy the equation x + 2y = −14.
Quadratic Functions and Practice
Next we will look at writing equations for quadratic functions. This is the form of a quadratic function.
Quadratic functions are parabolas and either have a U-shape or a mountain shape. Parabolas with a positive "a" value have a U-shape, and those with a negative "a" value have a mountain shape.
In addition, you know how to use a calculator to check for the correct answer, so you can input these equations in the equation editor (Y=) as well.
Example
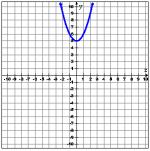
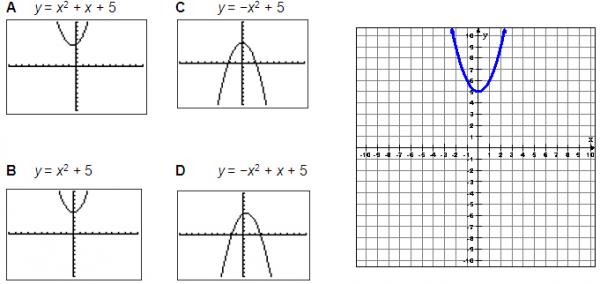
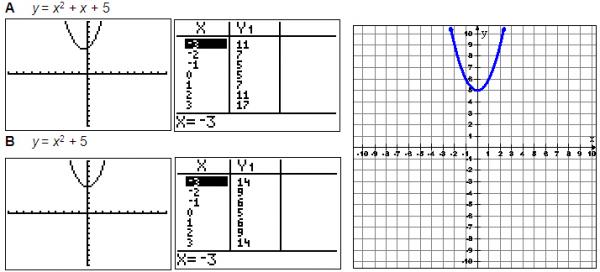
Which quadratic equation best represents the parabola shown below?
You can test each of the answer choices by using your graphing calculator to eliminate obviously wrong answers.
- Enter the equation in Y=.
- Graph the equation.
Each graph looks like this.
Options C and D are obviously wrong because they are facing down.
Now we can look at the table values for the remaining graphs. The graph we were given contains the points (-2, 9), (-1, 6), (0, 5), (1, 6), and (2, 9). Use the TABLE.
Now you can confidently pick option B as your answer.
Remember, you can also use the TRACE key to check points on the graph. Press TRACE, type in the x-value, and press ENTER.
