Introduction
When you are working with the probability that an event could happen, that is called theoretical probability.
For example, when rolling a typical six-sided number cube, there is only one "6" on the cube and an equal chance of any number landing face up.
 There are other types of probability. Sometimes, a simulation or a series of events has already occurred, and there is data that can be used to make a prediction. If you are estimating probability based on data that has been collected, it is called experimental probability.
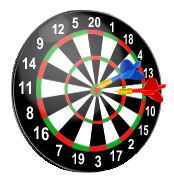
For example, if a dart is randomly thrown at a dartboard 40 times, data can be collected based on the numbered sector in which the dart lands.
|
Dartboard Data
|
|
|---|---|
|
Range of Numbers
|
Number of Dart Landing
|
|
1–5
|
11
|
|
6–10
|
9
|
|
11–15
|
8
|
|
16–20
|
12
|
Working with both theoretical and experimental probability is important, since frequently in the real world, what should happen, and what really does happen, are quite different!
Comparing Theoretical and Experimental Probabilities
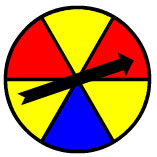
In this section, you will use a spinner simulator to conduct several "spins" in order to compare theoretical probabilities with experimental probabilities.
Use the "Spinner" below which has three equal-sized sections that are blue, red, and yellow.
- Spin the spinner a total of 30 times
- Record your results in the table.
|
Color
|
Number of Spins
|
|---|---|
|
Red
|
|
|
Yellow
|
|
|
Blue
|
|
Assume that the areas of each sector of the spinner are the same.
- What is the theoretical probability of the spinner landing on each color?
- Based on the theoretical probability of the spinner landing on each color, how many spins out of 30 spins should land on each color?
- Did the actual results of the spins match the results predicted by theoretical probability? Why do you think that is the case?
Repeat the process with the same spinner for a total of 100 spins.
- Based on the theoretical probability of the spinner landing on each color, how many spins out of 100 spins should land on each color?
- Did the actual results of the spins match the results predicted by theoretical probability? Why do you think that is the case?
Using Probabilities to Make Predictions
Because theoretical and experimental probabilities are ratios, we can use proportions with probabilities to make predictions.
The results of a random survey of 8th grade students at Summit Middle School showed that 32 out of 70 students prefer listening to country music. If there are 490 students in the 8th grade at Summit Middle School, approximately how many students would be expected to prefer listening to country music?
Solve the proportion that you set up in order to determine the answer to the original question,
How many students would be expected to prefer listening to country music?
Practice
1. The probability that one wristband is defective is . In a case of 840 wristbands, how many would be defective?
2. Benita observed that 28 out of 55 patrons at the public library used the computer. The librarian told Benita that 660 patrons enter the library throughout the day. Based on Benita's observations, how many patrons during the day would be expected to use the computer?
3. Clayton selected number tiles out of a bag. He recorded his results in the table.
|
Number Tile Selections
|
|
|---|---|
|
Number
|
Frequency
|
|
1
|
6
|
|
2
|
4
|
|
3
|
5
|
|
4
|
8
|
|
5
|
7
|
|
6
|
10
|
Based on these results, if Clayton draws 100 tiles, how many odd numbers should he expect to draw?
Summary
You compared two different types of probability: theoretical probability and experimental probability.
Theoretical probability is the ratio of the number of favorable outcomes to the number of total possible outcomes. Experimental probability is the ratio of the number of times an event occurs to the total number of trials.
In other words, theoretical probability is a ratio that describes what should happen, but experimental probability is a ratio that describes what actually happened.
Differences between Theoretical and Experimental Probabilities
You can use theoretical and experimental probabilities to distinguish between the likelihood of something happening from a purely theoretical perspective and the chances of something happening based on actual results.
|
Arturo's Results
|
|
|
Color
|
Number of Spins
|
|
Red
|
9
|
|
Yellow
|
16
|
|
Blue
|
5
|
|
Arturo's Experimental Probability Compared to the Theoretical Probability
|
||
|
Color
|
Theoretical Probability
|
Experimental Probability
|
|
Red
|
|
|
|
Yellow
|
|
|
|
Blue
|
|
|
Making Predictions
You can also use theoretical and experimental probabilities to make predictions from situations by treating them like proportion problems.
The results of a random survey of 8th grade students at Jamison Middle School showed that 15 out of 45 students like eating lunch at 10:30 a.m. If there are 330 students in the 8th grade at Jamison Middle School, approximately how many students would be expected to prefer eating lunch at 10:30 a.m.?
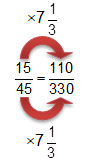
110 students would like eating lunch at 10:30 a.m.