Test Prep for AP® Courses
A researcher has been tracking a population of turtles. The researcher marked 200 young turtles just after hatching. A year later, collection data reveal that about 80 percent survived. A year after that, collection data revealed that about 60% of the original group was still living. After a third year, about 40 percent could be found alive. What do these data say about the survivorship curve that would best describe this population? Explain your reasoning.
- Type II survivorship curve because the number of survivors decreases by the same value (20 percent) every year.
- Type I survivorship curve because the number of survivors decreases by the same value (20 percent) every year.
- Type II survivorship curve because the number of survivors increases by the same value (20 percent) every year.
- Type IV survivorship curve because the number of survivors decreases by the same value (20 percent) every year.
- What is the population distribution of this salamander species in this ecosystem?
- What is the rate of population growth of this salamander species in this ecosystem?
- Which animal species prey on this salamander species in this ecosystem?
- What abiotic resources are essential for the survival of this salamander species in this ecosystem?
These graphs summarize data collected in an area of Brazil between 2005 and 2006. Researchers captured mosquitoes and counted the number of parous females. Parous females are females that produced viable offspring.

(credit: Revista da Sociedade Brasileira de Medicina Tropical)
Based on the information given, how would mosquito populations change in Brazil if the climate shifted to very hot (above 30°C) and very dry (below 60 percent humidity) conditions for an extended period of time? Explain your reasoning.
- The mosquito populations would decrease at temperatures above 30 °C as this is the upper limit for parous females, leading to a drop in offspring production. Not much change would be seen in the population of mosquitoes if the humidity dipped below 60 percent without a temperature change.
- The mosquito populations would decrease, possibly reaching zero. As temperatures above 30 °C are the upper limit for parous females, offspring production would drop. Drier conditions would have the same effect.
- The mosquito populations would stay the same because temperatures above 30 °C and humidity below 60 percent is close to the favorable conditions of offspring production by parous females.
- The mosquito populations would stay the same at temperatures above 30 °C as higher temperatures will not affect the production of viable offspring by parous females. Drier conditions, below 60 percent humidity, would cause a drop in the population as it is the lower limit for offspring production.
Researchers were interested in answering the question, “How does sheep grazing affect the population densities of wild mountain birds?” To answer this question, the researchers counted population numbers of various birds in areas of low-intensity sheep grazing and in areas of high-intensity sheep grazing. A third set of data was collected from control areas in which no sheep grazing occurred. The results of this study are shown in these graphs.

(credit: The Royal Society Publishing: Biology Letters)
All of the bird species eat insects as their primary source of nutrition. The group labeled insect eaters combines many species because the numbers for individual species were too small to show separately as shown for the meadow pipit and willow grouse, which are both highly abundant. Because all of the birds are insect eaters, construct a scientific question related to this fact that the researchers could ask to refine their study even further. Explain your reasoning.
- Does sheep grazing make insects more available to birds? This question refines the question about how sheep grazing affects bird populations because it asks more specifically how sheep grazing changes the food availability for the birds.
- How does sheep grazing make insects more available to birds? This question refines the question about how sheep grazing affects insect populations because it asks more specifically how sheep grazing changes the food availability for the insects.
- Does sheep grazing make insects more available to birds? This question refines the question about how sheep grazing affects bird populations because it asks more specifically how sheep grazing changes the food availability for the insects.
- How does sheep grazing make insects more available to birds? This question refines the question about how sheep grazing affects bird populations because it asks more specifically how sheep grazing changes the food availability for the insects.
- The population sizes of all organisms will decrease in response to lower energy flowing into the pond.
- The population densities of all organisms will increase in response to lower temperatures in the pond.
- The population distributions of large organisms will shift from clumped to random in response to lower energy flowing into the pond.
- The population distributions of small organisms will shift from uniform to clumped in response to lower temperatures in the pond.
- When does this plant species flower and how does it attract pollinators?
- Does this wildflower species have any adaptations that function to defend the plant against herbivores?
- Which species of insects and/or birds are pollinators for this wildflower species?
- Does this wildflower species secrete any chemical compounds that inhibit growth of others of its species?
- Flies having traits that traded early reproductive energy for greater storage of energy in their bodies were favored via natural selection because they survived the cold better than flies that did not have these traits.
- In cold conditions, flies have less need for reproduction than in warm conditions and so energy normally used for reproduction is diverted to other survival functions.
- Flies respond to weather conditions to shift their energy resources to either storage in their bodies in the cold or to reproduction when conditions become warm again.
- All fruit flies have the same genetic makeup, but express different patterns of genes under different conditions, which results in expression of certain genes for cold conditions and others for warm conditions.
Female parasitoid wasps lay their eggs inside the bodies of caterpillars. The caterpillars die when the eggs hatch, and the young wasps feed on the body of the caterpillar. Egg-laying females of two species of parasitoid wasps were studied in special growth chambers in which a food source was either provided or omitted. This table summarizes some of the data collected.

(credit: Brazilian Archives of Biology and Technology)
Identify the statement most consistent with these data.
- When energy availability is low, females put more energy than normal into producing offspring.
- When energy availability is high, females produce offspring with higher viability.
- When energy availability is low, females shift energy away from reproduction and toward their own survival.
- When energy availability is high, females cannot both produce viable offspring and maintain their own survival.
During breeding season, many female elk mate with males, but not all mated females become pregnant. Female elk having body fat less than 6 percent were found to have greatly reduced chances of becoming pregnant than female elk having body fat above 10 percent. Explain how natural selection was likely involved in establishing this trait in elk. (credit: USGS Northern Prairie Wildlife Research Center)
- Through natural selection, female elk that did not have the energy reserves to carry a pregnancy to term and did not become pregnant died whereas those which became pregnant anyway were favored.
- Natural selection favored the selection of traits preventing pregnancies in female elk with low fat reserves, so this trait has become predominant in natural elk herds observed today.
- Natural selection randomly changes the frequency of genes allowing traits preventing pregnancies in female elk with low fat reserves to be favored.
- Natural selection leads to a sudden inheritable change in the genome of the female elk, ensuring female elk with very high fat reserves to can effectively carry out pregnancy.
Research on elk in Yellowstone National Park was conducted to determine how body condition affects survival of the elk over the winter months. It was found that the probability of survival of female elk is greater when they have accumulated 15 percent or more body fat by the end of fall. Female elk with body fat less than 10 percent in late fall were found to be at high risk of not surviving the winter. Explain why this pattern is likely to be observed. (credit: USGS Northern Prairie Wildlife Research Center)
- In winter, the availability of food decreases. So, there needs to be a certain threshold level of energy their bodies store in the form of fat to ensure their survival.
- In winter, the availability of food increases. So, there should be a certain threshold level of energy in their bodies stored in the form of fat to ensure their survival.
- In winter, elk’s requirement for food increases due to increase in metabolic activities even though availability of food increases. So, there should be a certain threshold level of energy in their bodies stored in the form of fat to ensure their survival.
- Elk release more energy in winter. So, there should be a certain threshold level of energy in their bodies stored in the form of fat to ensure their survival.
The table contains birth rates and death rates for populations of several species living in the same ecosystem. Analyze the data.

Analyze the data to identify the population(s) experiencing a negative change in population size.
- species A only
- species A and species C
- species B and species D
- species B and species E
The data in the table were collected on the population size of a species of plant growing in a region during the years after a flood destroyed the area.

Explain what the data indicate about this population.
- The plant population grew exponentially throughout the years as the numbers of individuals increased at an exponential rate. The population eventually became stable after reaching a maximum number of 120 individuals, which could be the carrying capacity of the environment.
- The population grew exponentially in the first few years and later became logistic as the rate slowed down. The population eventually became stable after reaching a maximum number of 120 individuals, which could be the carrying capacity of the local environment.
- The plant population grew logistically throughout the years as the growth rate of the population slowed down. The population eventually became stable after reaching a maximum number of 120 individuals, which could be the carrying capacity of the environment.
- The population grew exponentially in the first few years and later became logistic as the rate slowed down. The population eventually became stable after reaching a number of around 116 individuals, which could be the carrying capacity of the environment.
- nectar energy provided to the butterfly species per visit to a flower of the plant species in a field
- number of fruits produced per flower of plants in a section of a field screened off from access by the butterfly species
- number of butterfly visits per flower per day in various fields throughout the growing range of the plant
- species of flowers visited by individual butterflies in a field and frequency of visits to each flower species
- Growth rate of trout in the stream before and after logging
- Death rate of trout in the stream after the introduction of logging
- Number of trout in the stream after the introduction of logging
- Number of trout in the stream before and after logging
- Humans will decrease their own carrying capacity, which will also decrease the carrying capacities of marine ecosystems.
- Decreased fishing can be expected, which will lead to rebounds in fish populations and healthier marine ecosystems.
- Increases in greenhouse gas emissions are likely, with increases in ocean temperatures that trigger shifts in marine populations.
- Biodiversity of marine ecosystems will increase as humans use engineering to increase food production in the oceans.
- The amount of waste generated by human activities will increase exponentially as the human population continues to increase exponentially. Removal of waste would require a decrease in habitats, which will lead to decrease in populations of species dependent on those habitats.
- The amount of waste generated by human activities will increase exponentially as the human population continues to increase exponentially. Removal of waste will require an increase in habitats, which will lead to exponential increase in populations of species dependent on those habitats.
- The amount of waste generated by human activities will decrease exponentially as the human population continues to increase exponentially. Removal of waste would require an increase in habitats, which will lead to exponential increase in populations of species dependent on those habitats.
- The amount of waste generated by human activities will decrease exponentially as the human population continues to increase exponentially. Removal of waste will require a decrease in habitats, which will lead to decrease in populations of species dependent on those habitats.
- rates of growth of newly established mussel cultures in a lab under different phytoplankton concentrations
- phytoplankton population changes in the estuary as a function of intensity and duration of sunlight exposure
- biomasses of natural mussel populations and phytoplankton populations in the estuary determined at many different times
- lab measurements of phytoplankton biomass in response to added mussel population numbers
- Run field tests in which dull individuals and brightly colored individuals are captured and switched into the other’s territory to see how many of each survive.
- Run field tests in which video cameras are set up to record predators capturing dull individuals and brightly colored individuals in their native territories.
- Run laboratory tests in which predators familiar with the venomous snake are offered dull individuals and brightly colored individuals to see if the predators show a preference.
- Run laboratory tests in which predators familiar with the dull colored nonvenomous snake are offered venomous brightly colored individuals and nonvenomous brightly colored individuals to see if the predators show a preference.
- Arrange containers of water in which water can be freely shared between two compartments. Fish are contained within one compartment and frogs in another such that the frogs on one side cannot see or hear fish on the other side. Observe and compare the egg-laying behavior of female frogs in the presence and absence of predator fish in the fish tank.
- Arrange containers of water in which water can be freely shared between two compartments. Fish and frogs are contained within one compartment such that frogs cannot see or hear fish. Observe and compare the egg-laying behavior of female frogs in the presence and absence of predator fish.
- Arrange containers of water in which water can be freely shared between two compartments. Fish and frogs are contained within one compartment such that frogs can see or hear fish. Observe and compare the egg-laying behavior of female frogs in the presence and absence of predator fish in the fish tank.
- Arrange containers of water in which water can be freely shared between two compartments. Fish are contained within one compartment and frogs in another such that frogs on one side can see or hear fish on the other side. Observe and compare the egg-laying behavior of female frogs in the presence and absence of predator fish in the fish tank.
A biologist studied two populations of the same species of a small fish living in different locations in the same tropical stream. He noticed that adult male fish were either spotted or unspotted and made careful counts of the two variants in the two stream locations in 1998. He repeated his population studies 10 years later. The table summarizes the data.

Construct a hypothesis that accounts for these data.
- A new prey species of the fish established itself only in the downstream portion of the stream between 1998 and 2008.
- A new prey species of the fish established itself only in the upstream portion of the stream between 1998 and 2008.
- A new predator of the fish established itself only in the downstream portion of the stream between 1998 and 2008.
- A new predator of the fish established itself in both the upstream and downstream portions of the stream between 1998 and 2008.
A species of marine snail is found in shallow waters near coastlines. This snail feeds on detritus on the ocean bottom. Researchers noticed that snails in one area had a mottled appearance, while snails in another area were solid in color. The researchers set up areas in each region for study and then released both mottled and solid snails into the solid snail region and released both mottled and solid snails into the mottled snail region. The survival rate of each variant was measured. Results are summarized in this table.

Construct a possible hypothesis that accounts for these data. Explain your reasoning.
- A possible hypothesis is that the coloration of the snail is dependent on environmental conditions. Camouflage in both mottled and solid snails is best during optimum environmental conditions and does not change according to the region in which they are placed.
- A possible hypothesis is that the coloration of the snail is an adaptation in the form of camouflage to protect the snail from predators in the region it is invading. Mottled snails are best camouflaged in the solid snail region and stand out to predators and suffer greater predation when placed in their native region.
- A possible hypothesis is that the coloration of the snail is an adaptation in the form of camouflage to protect the snail from predators in its native region. Mottled snails are best camouflaged in their native region and stand out to predators and suffer greater predation when placed in the region normally occupied by solid snails.
- A possible hypothesis is that the coloration of the snail is an adaptation in the form of camouflage to protect the snail from predators in its native region. Solid snails are best camouflaged in mottled snail region and are more obvious to predators when placed in their native region.
The graph summarizes data concerning four different species of lizards that inhabit tropical habitats.

Predict how these species will be able to coexist if they inhabit the same region of a tropical habitat.
- All species will coexist with one another because they consume the same amounts of food.
- Species A, B, and C will best coexist because of their similarities in amount and type of food eaten.
- Species A and B will best coexist because they have the most overlap in diet.
- Species D will best coexist with any one of the other species because this species eats completely different types of food.
Warblers are a group of small songbirds consisting of many species. The table summarizes data collected on the diets of two species of warblers. In addition, both species A and B use the same types of nesting materials and sites for building nests.

A biologist observes that Species A and Species B primarily inhabit different regions of a forest in western Canada. During a forest fire that wiped out the region it inhabited, Species B fled to the region inhabited by Species A. Predict what is likely to happen to these two species in the future. Explain your reasoning.
- Both the species will survive because of difference in needs for food.
- Species A will increase in population whereas species B will remain the same due to the overlapping needs for food.
- Unless the species can modify their diets, it is likely that only one of these species will survive in this region due to the difference in needs for food. The species that loses will either die off or migrate to another region.
- Unless the species can modify their diets, it is likely that only one of these species will survive in this region due to the overlapping needs for food. The species that loses will either die off or migrate to another region.
103.
The percentage areas of ground covered by blackberries and native shrubs were plotted over time, as shown in the graph.

Himalayan blackberries are an invasive species that has spread in the forest of the Pacific Northwest. The plants develop thick tangles of cane covered with thorns that cover ground with a tight mat. Ecologists hypothesized that Himalayan blackberries displace native species of shrubs by reproducing faster and reducing areas available for growth. They recorded the density of blackberries and native salmonberries, a native shrub, along a creek for several years.
- Blackberries promote the growth of salmonberry shrubs.
- Blackberries and salmonberry shrubs do not interfere with each other’s growth.
- Salmonberry shrubs prevent the growth of blackberries.
- Blackberries displace salmonberry shrubs.
- Biodiversity of these northernmost regions will remain constant as humans will find other more habitable locations to house their growing numbers.
- The populations of organisms presently inhabiting these regions will shift as global warming causes many species to decline and new species to move in.
- The carrying capacity of these regions for humans will decrease as the human population increases exponentially.
- Ecosystems can be expected to remain untouched by humans as new technologies are developed to sustain a growing population.
- genetic analyses of adult male frogs raised in isolation and in multigenerational frog communities
- field observations of adult frogs in their native habitat during mating season
- video recordings of individual frogs raised in large multigenerational frog communities
- audio recordings of individual frogs at sexual maturity after being raised in total isolation
- The biologist can use video cameras to record the behavior of birds coming to the feeders.
- The biologist can leave an audio recorder near the feeders.
- The biologist can record the behavior of birds by comparing them with other birds using video cameras.
- The biologist could observe the birds continually for one month.
Yellow buntings are birds that feed on butterflies, including Aglaisurticae, a species of butterfly that has bright circular coloring on its wing called an eyespot. Biologists have hypothesized that eyespots mimic owl eyes. Owls are predators of yellow buntings.
In laboratory experiments using yellow buntings captured from the wild and held in captivity, individual birds were observed during sessions in which they were given butterflies that had either not been treated or had been treated to remove their eyespots. Yellow buntings were scored according to whether they showed fleeing behavior when they encountered butterflies of both types. The data were compiled in this table.

How do these data support the claim that one species’ response to information can affect natural selection in another species?
- Comparison of the total number of encounters shows that more birds responded to the eyespot, a trait that will likely be selected against in natural populations of the butterfly.
- Comparison of the number of birds attacking butterflies with and without eyespots suggests that the presence of an eyespot makes butterflies more visible to predators resulting in selection against the trait.
- Comparison of the number of birds fleeing from butterflies with and without eyespots indicates that the eyespot trait has been disfavored because this trait makes the butterflies stand out to predators.
- Comparison of the number of birds fleeing from butterflies with and without eyespots suggests that selection has occurred in butterflies in favor of the eyespot trait, which mimics a predator of the bird.
Biologists analyzed the sound frequencies of different calls made by a small bird species that serve as prey for a much larger predator bird species. The small bird makes three different kinds of calls: a mobbing call that a group of adults make when mobbing a single predator bird in defense of their nests, a scolding call that a single bird makes to scold a predator bird perched nearby, and a warning call that a single bird makes to warn other birds when a predator bird flies into the vicinity. A table was created to summarize the data from this analysis and show the range of sound frequencies audible to the prey and predator species.

(credit: Behavioral Ecology and Sociobiology)
Explain how these data support the claim that communication of information affects natural selection in the small bird species.
- A scolding call made by small birds can be heard by large predator birds, which is required to scold away the birds; therefore, this trait is favorable and has been naturally selected.
- As the mobbing call made by small birds can be heard by large predator birds, therefore small birds cannot defend their nests without the predators knowing. This unfavorable trait is thus naturally selected.
- The warning call made by small birds cannot be heard by large predator birds, giving the small birds an advanced warning. This is an unfavorable trait that gives birds a survival disadvantage.
- The warning call made by small birds cannot be heard by large predator birds, giving the small birds an advanced warning. This is a favorable trait that gives birds a survival advantage.
- Monarch butterflies fly up to 3,000 miles from their summer habitat in North America to their winter habitat in Mexico.
- Because the life span of a Monarch butterfly is so short, not every generation of Monarchs migrates.
- Monarch caterpillars feed on milkweed while adult butterflies feed on flower nectar.
- Changes in day length trigger hormonal and nervous system changes in Monarchs that result in behavioral changes.
- Grizzly bears go into hibernation at the end of winters. This observation provides evidence that there is some environmental cue that triggers physiological changes in bears.
- Grizzly bears do not go into hibernation at the beginning of autumn. This observation provides evidence that there is some environmental cue that triggers physiological changes in bears.
- Grizzly bears go into hibernation at random times during the year. This observation provides evidence that there is some environmental cue that triggers physiological changes in bears.
- Grizzly bears do not go into hibernation at random times during the year. This observation provides evidence that there is some environmental cue that triggers physiological changes in bears.
- A species of salmon will migrate up the same river regardless of increases in predators that visit these waterways from one year to the next.
- Female elk that had difficult deliveries of calves will continue to mate with males in succeeding mating seasons.
- Bears that receive food from humans are later more likely to break into human habitations than bears that are not approached by humans.
- A bird raised from an egg isolated in a lab environment will give the same alarm call as birds of the same species raised in the wild.
- The lizard would sit on a rock to remain protected from predation and water loss. The breathing and heart rate would slow as it begins estivating. Then it would only do critical activities needed to sustain its living state.
- The lizard would live in a shaded spot to remain protected from predation and water loss. The breathing and heart rate would slow as it begins estivating. This way a lizard can perform all activities.
- The lizard would stay in a shaded spot to remain protected from predation and water loss. Its breathing and heart rate would slow as it begins estivating. Then it would only do critical activities needed to sustain its living state.
- The lizard would live in a shaded spot to remain protected from predation and water loss. The breathing and heart rate would increase as it begins estivating. Then it would only do critical activities needed to sustain its living state.
Many animals produce chemical compounds that function as alarm cues. Researchers interested in determining whether salamanders fall into this group performed the following experiment. Long-toed salamanders were captured from the wild. A few were injured, and tissue from their injuries was collected and ground up with water. This solution was used to moisten a paper towel. Others were not injured and placed on moistened paper towels for 48 hours. The moistened paper towels were placed at one end of a rectangular box (stimulus end), and a paper towel moistened with water was placed at the other end (control end). In each test, a salamander was placed in the center and the researchers observed the direction in which the salamander moved. Multiple trials were performed using paper towels moistened with chemicals from injured and noninjured salamanders, and the data were compiled into a table.

Many animals produce chemical compounds that function as alarm cues. Researchers interested in determining whether salamanders fall into this group performed the following experiment. Long-toed salamanders were captured from the wild. A few were injured and tissue from their injuries was collected and ground up with water. This solution was used to moisten a paper towel. Others were not injured and placed on moistened paper towels for 48 hours. The moistened paper towels were placed at one end of a rectangular box (stimulus end) and a paper towel moistened with water was placed at the other end (control end). In each test, a salamander was placed in the center and the researchers observed the direction in which the salamander moved. Multiple trials were performed using paper towels moistened with chemicals from injured and non-injured salamanders and the data was compiled into a table. Which of the following statements is an accurate analysis of the data?
- This salamander releases chemical compounds during injury that elicit avoidance behavior in members of its own species.
- Chemical compounds released from this salamander species during injury elicit attractant behavior in members of its own species.
- Both injured and non-injured salamanders produce chemical compounds that elicit avoidance behavior in non-injured salamanders.
- There was a statistically significant difference between stimulus and control results from treatment involving non-injured salamanders.
 (credit: Ethology)
Biologists have observed some animal species making predator warning calls when no predator is in the area. In one species of bird, for example, individuals appeared to perform this behavior as a means for deceiving other birds into fleeing from a food source that the bird making the call was then better able to access.
In investigating the possibility that this bird species uses false alarm calls to improve its access to food, the following experiment was conducted. Researchers set up a bird feeding table in a protected area to attract two species of birds, species A and B. They either clumped food in one concentrated pile on the table, allowing a few birds to feed simultaneously, or dispersed the food in a much wider area under and around the table so that it was available to large numbers of birds. They then observed the number of times an individual in species A gave a predator warning call and whether species B was present at the feeding table. The data collected by the researchers are shown in the table.
This representation was created to describe how the behavior of a cat was affected as it was exposed to different stimuli.
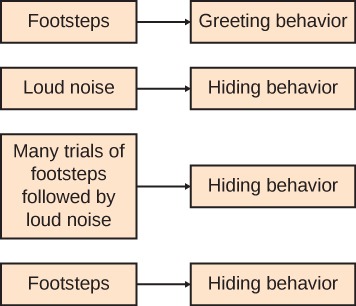
Which term describes the process represented by the exposure to footsteps followed by loud noise in this diagram?
- innate behavior
- classical conditioning
- operant conditioning
- cognitive learning
- seasonal changes, physiological changes, migration, and behavioral changes, respectively
- physiological changes, seasonal changes, behavioral changes, and migration, respectively
- seasonal changes, behavioral changes, physiological changes, and migration, respectively
- seasonal changes, physiological changes, behavioral changes, and migration, respectively
- aural signals
- pheromone signals
- tactile signals
- visual signals
- Herring gulls have a brightly colored bill. When a predator approaches, the parent gull stands over its chick and taps the bill on the ground in front of it, which elicits a begging response from a hungry chick.
- Prairie dogs live in underground burrows. If a look-out observes an approaching predator, they give an aural alarm cry communicating the information to the foraging individuals who then run back to safety.
- Herring gulls have a brightly colored bill. When a predator approaches, the parent gull stands over its nest and taps the bill on the ground to elicit a begging response from its chick, thereby warning other gulls.
- Prairie dogs live inside the bark of trees. If a look-out observes an approaching predator, they give an aural alarm cry communicating the information to the foraging individuals who then run back to safety.