Science Practice Challenge Questions
20.1 Organizing Life on Earth
The figure shows a plot of the fraction, as a percentage, of families of marine organisms living at a particular point in time that became extinct (vanished from the fossil record) in the next geological moment. These mass extinctions mark the ends of geologic periods. For example, the Triassic period ended around 213 million years ago (Mya).

A. The fact that evolution is an ongoing process is illustrated by these data. Whether the process displays a pattern involving regular intervals is a question that has been raised. Of those who believe periodicity is present, a period of 26 million years is favored. A wave with this periodicity is drawn on the figure. Evaluate the evidence provided in terms of agreement and disagreement with the marine extinction record.
The Cretaceous and Jurassic were periods of warm landmasses covered by a shallow sea. The ends of these periods are known to be due to asteroids that left a sedimentary trace. At the end of the Triassic, there is no evidence of an asteroid impact. Instead, there was massive volcanism associated with the opening of the Atlantic Ocean, a four-fold increase in carbon dioxide, and a 3–6 °C temperature rise (A. Marzoli et al., Science, 1999). Macrofossil, spore, and pollen data show that marine animal species declined much more than marine plant species (L. Mander et al., Proc Natl Acad Sci, 2010). The cause of the end of the Permian period is less uncertain, but an 8-°C temperature rise has been established (McElwain and Punyasena, Trends in Ecology and Evolution, 2007). Both terrestrial and marine taxa were affected.
B. The graph estimates the number of distinct families, including both marine and terrestrial, as a function of time before the present. Note that the time scale for this graph is much longer than that of the previous graph.
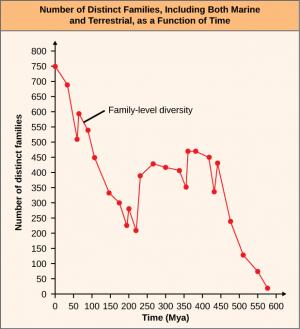
Analyze this graph by:
- identifying times of mass extinctions
- posing a question regarding any difference between the graph of extinctions of marine life and the graph of family-level diversity
- explaining the slope of the graph of family diversity following a mass extinction event
20.2 Determining Evolutionary Relationships
Lactate dehydrogenase, an enzyme involved in glycolysis, from several species is compared using a Southern blot technique in the figure: (A) yeast; (B) snail; (C) mouse; (D) rat; and (E) human (after K. Webster, Journal of Experimental Biology 2003).

A. Justify the claim that these data provide evidence that supports glycolysis as a conserved core property.
There are three forms of lactate dehydrogenase whose roles vary within an organism: LDH-A, -B, and -C. The question arises as to the origins of each. The cladogram (after S. Tsuji et al., Proc. Natl. Acad. Sci., 1994) displays a proposed relatedness of variations in LDHs over many species.

B. Based on these data, describe the differences between the likely evolutionary sequences of LDH-A, -B, and -C in the African frog and in humans.
C. Evaluate the claim that in both species (African frog and human), LDH-C is the most recently evolved form of the enzyme.
Nucleotide-repeat sequences often occur within the intron, and sequence variation is neutral, that is, there is no selection. For example, the nucleotide-repeat sequence labeled A might be ACGGGC, and the repeat sequence labeled B might be ACTGGT. Repeat sequences evolve by single-step duplication, deletion, and inversion, rather than by single-nucleotide substitution. Because these repeat sequences can be used to infer phylogeny, a phylogenetic tree can be hypothesized based on the principle of parsimony—the simplest explanation is the best explanation. Consider the repeat sequences A, B, C, D, and E shown in the list in which only inversions have occurred among five different species.
• Species 1: ABCDE
• Species 2: ADCBE
• Species 3: BACED
• Species 4: DACBE
• Species 5: ABCED
• Species 6: DEBCA
A. Pose three questions that can be used to infer the evolution of these five species.
B. Draw lines between nearest relatives to construct a cladogram that displays the relationships inferred by answers to your questions.

Carson (Drosophila Genetics 1983) used inversions in intron-repeat sequences of the fruit fly to infer evolution among the Hawaiian Drosophila. He further assigned the chronological sequence of islands on which the flies appeared by assuming (parsimoniously) that the geologically oldest of the volcanic islands was home to the oldest fly ancestor. When a fly or flies arrived on a newer island, speciation occurred, which, after a time, stabilized until another island hop occurred.
C. Evaluate Carson’s reasoning for speciation and ongoing evolution.
D. Pose two questions whose pursuit could provide additional evidence of Carson’s hypothesized evolutionary sequence.