Introduction
This lesson will cover using multiple representations of data to solve problems. The three techniques that you will use in this lesson are provided below.
|
Reading numbers directly out of the table |
 |
|
Estimating a value between two numbers in the table |
 |
|
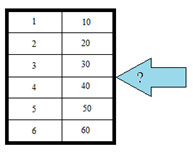
Using the table to create a pattern that helps to solve the problem |
 |
The sections of this lesson will look at these individually.
Reading Values Directly from a Table
Data tables are a convenient way to organize information. You can find the answer to many problems by reading values from the table.
Consider the following situation.
 |
An engineer is testing the effectiveness of the brakes in stopping a new car. In one test, she drives the car at different speeds (measured in miles per hour) and measures the distance in feet that it takes for the car to stop once the breaks are applied. Her data is shown in the following table. |
 |
Use the information in the table below to answer the questions that follow. If you need a hint, click on the hint button.
| Speed | Stopping Distance |
|---|---|
| 20 | 19 |
| 25 | 30 |
| 30 | 43 |
| 35 | 58 |
| 40 | 76 |
| 45 | 97 |
In an advertisement, a carpet cleaning company displays their pricing plan by using the following table.
| Number of rooms | Price |
|---|---|
| 1 | $19 |
| 2 | $29 |
| 3 | $39 |
| 4 | $49 |
| 5 | $59 |
| Whole house special | $65 |
Estimating a Value Between Two Numbers in a Table
Sometimes a problem asks you for information that is not directly given in the table. Read the following problem and answer the questions that follow.
 |
Ashaki is growing a bean plant for a science fair project. She measures the height of the plant in inches each week and records the height in her data table. According to the information in the table, approximately when did the plant have a height of 2 inches? |
 |
| Week | Height |
|---|---|
| 1 | 0.8 |
| 2 | 1.6 |
| 3 | 2.3 |
| 4 | 2.9 |
| 5 | 3.5 |
For help finding the answer, watch the following video.
Based on what you learned in the video, try the following problem.
Jose is reading a newspaper article for a current events project in his social studies class. The article contains the following data table showing the change in population of a small town over the last 10 years.
| Year | Population |
|---|---|
| 2001 | 17,000 |
| 2003 | 16,200 |
| 2005 | 15,400 |
| 2007 | 14,600 |
| 2009 | 13,800 |
| 2011 | 13,000 |
In what year was the population approximately 15,000 people?
To determine the year in which the population was approximately 15,000, we need to look between two values on the table.
Check your answer below.
Using a Pattern to Solve a Problem
Some problems give data tables that simply don't extend far enough to give the information you need. The problems require you to determine the pattern used in creating the table and then follow that pattern to find the solution.
Consider the following situation.
 |
Steve is helping his mom by washing windows. She pays him for every window that he washes. The following table shows how much Steve can expect to earn based on the number of windows that he washes. |
 |
| Windows | Pay |
|---|---|
| 1 | 0.5 |
| 2 | 1.00 |
| 3 | 1.50 |
| 4 | 2.00 |
| 5 | 2.50 |
Based on the information in the table, how much should Steve expect to earn for washing 9 windows?
In this case the table doesn't give any information for more than 5 windows.
- How can you determine the amount Steve will be earning for washing more than 5 windows?
- How could you determine the amount Steve will earn for washing any number of windows?
Copy the following extended table into your notes, and then use your rule to fill in the missing information.
|
Windows |
Process |
Pay |
|---|---|---|
| 1 | 1(0.50) | 0.50 |
| 2 | 2(0.50) | 1.00 |
| 3 | 3(0.50) | 1.50 |
| 4 | 4(0.50) | 2.00 |
| 5 | 5(0.50) | 2.50 |
| 6 | 6(0.50) | |
| 7 | ||
| 8 | ||
| 9 | ||
| 10 |
Click here to see the completed table.
- How much will Steve earn for washing 9 windows?
- Write the rule that you used to fill in the extended table as an equation that you could use to calculate p, the amount that Steve earns for washing w windows.
- Use your new equation to check the answer you found from the table.
Practice
Answer the following questions by reading directly off the table, estimating an answer between two entries in the table, or by using a pattern to extend the table.
1. The following table shows the scores earned by 5 students on Mr. Garza's last math quiz.
| Student | Score |
| Maria | 87 |
| Juan | 83 |
| Sara | 72 |
| Shantel | 91 |
| Matt | 89 |
2. Miguel is trying to keep track of his spending. Over the summer he earned $750 mowing lawns and babysitting. Each week he allows himself a small spending allowance. He keeps track of how much money he has left on the following table.
| Week | Money |
| 1 | $750 |
| 2 | $700 |
| 3 | $650 |
| 4 | $600 |
| 5 | $550 |
3. Sasha is keeping track of the outside temperature for a school project. The following table shows her data for one evening.
| Time | Temperature |
| 5:00 | 76° |
| 6:00 | 74° |
| 7:00 | 72° |
| 8:00 | 70° |
| 9:00 | 68° |