In this lesson, you and your team will be asked to evaluate the types of assessment measures used at your campus for monitoring students' progress toward targeted literacy goals. You will also consider how effectively progress monitoring data is used at your campus to identify students' specific instructional needs. To begin, let's explore the concept of "monitoring progress" and the various ways it is applied in instruction.
An overview of progress monitoring
The practice of monitoring progress is hardly new in the field of education, and it is very likely that the effective teachers at your campus already do this in a variety of ways. Broadly speaking, monitoring progress is about answering questions such as Are my students learning on pace to attain grade-level expectations? Are they getting the new concepts I am teaching? What new concepts are my students struggling with?
In order to answer these questions, teachers commonly engage in formative progress monitoring. Formative progress monitoring refers to examining the data collected during instruction that tells teachers how students are progressing in their mastery of new concepts and helps teachers adjust instruction accordingly. As Wixson and Valencia (2011) explain, this type of progress monitoring often consists of "informal measures that are used on an ongoing basis in daily instruction" (p. 467). These measures include many types of tools, ranging from teacher-created assessments to work samples to anecdotal records. Some assessments, such as department and district tests, may be used at specific points within the curricular scope and sequence to monitor students' mastery of concepts being taught during that time period. Usually, all students receive these kinds of assessments.
Formative progress monitoring is important to literacy instruction, particularly in measuring students' mastery of the core literacy curriculum. However, this approach is not the focus of this lesson. When we consider the objectives of response to intervention (RTI), the concept of "monitoring progress" takes on a more nuanced meaning. Together with universal screening, researchers have identified progress monitoring as an essential component of assessment within RTI since progress monitoring is focused specifically on students' response to the intervention (Chard, Harn, Sugai, Horner, Simmons, & Kame'enui, 2008). Progress monitoring is an essential component of RTI frameworks in secondary schools, as well as elementary schools (Reed, Wexler, & Vaughn, 2013).
When practitioners consider the role of progress monitoring assessment within RTI, their responsibility is not just limited to how well all students are mastering new concepts in the core classroom. Educators must also consider whether a student is responding to an intervention and progressing at an accelerated pace in order to close the achievement gap between the student and his or her on-track peers. This raises questions such as How do I assess the progress of students who have been identified with specific literacy needs? How do I know the extra support I am providing to these students is working? How can I better allocate resources to accelerate the progress of students?
This lesson will focus on addressing questions such as these and guide you in understanding the role of progress monitoring within your campus assessment plan.
Progress monitoring within an RTI framework
Lessons 1 and 2 of the Assessment module use an analogy of a medical assessment to explain different aspects of educational assessment. Universal screening is compared to the common medical practice of measuring a patient's blood pressure to screen for potential health issues. Lesson 3 discusses how important it is to use additional assessments to diagnose the causes of high blood pressure in order to design the best treatments for patients. This analogy can be taken a step further to explain progress monitoring.
Imagine that during your annual physical exam, your medical practitioner sees that your blood pressure is elevated and, upon further testing, diagnoses you with high cholesterol. Your doctor then puts you on a treatment plan that includes a modified diet, a daily exercise routine, and a prescription medication. Once your doctor starts you on this treatment plan, it is very unlikely that he will wait until your next annual physical to check if your health is improving. More likely, your doctor will recommend more frequent visits and blood tests in order to assess how the treatment plan is working. Based on more regular assessments, he will adjust the treatment plan accordingly.
Just as a doctor checks in to measure the patient's response to the treatment plan, a teacher uses progress monitoring assessments to measure students' response to an instructional plan. Formal progress monitoring tools are repeated measures that capture student learning. They are usually brief assessments, and they are reliable, valid, and evidence based. Typically, progress monitoring assessments are given only to students in need of intervention or those who educators think might be in need of intervention. Progress monitoring tools measure age-appropriate outcomes, and different tools may be used to assess different outcome measures (e.g., phonemic awareness, fluency, comprehension). Based on these criteria, progress monitoring serves the following purposes:
- To monitor students' response to Tier I, II, or III instruction to estimate rates of improvement
- To identify students who are or are not responding adequately to Tier I, II, or III instruction
- To compare the efficacy of different forms of instruction in order to design more effective, individualized instruction
To get a valid picture of how students are progressing toward targeted literacy goals, practitioners examine a "trend." This refers to how much students are improving over time, regardless of where they started or what their scores were on one individual assessment. Usually, in secondary schools, progress monitoring assessments are administered bi-weekly or monthly for students receiving supplemental support (depending on the level of intensity of the intervention and the breadth of the achievement gap). Therefore, the trend is determined by calculating a slope over weeks of several progress monitoring assessments. The hope is that the slope will show the score increase over time, as the following example illustrates:
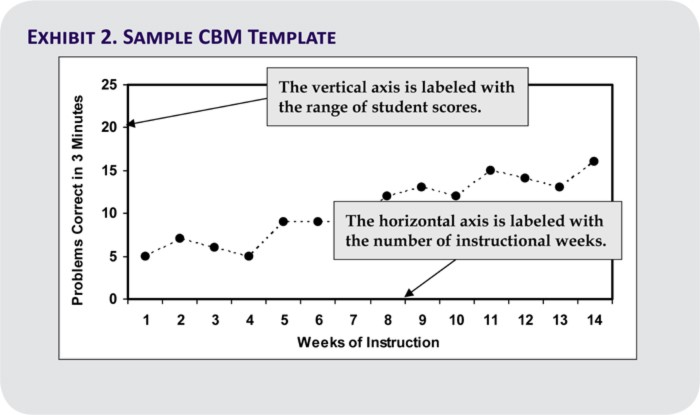
(National Center on Response to Intervention, 2012)
In this example, you can see that the vertical (Y) axis represents the range of scores on a specific progress monitoring measure. The scores shown here would match the appropriate range of scores for the measure you are using (e.g., words read correctly). The horizontal (X) axis represents the number of instructional weeks.
Progress monitoring information becomes most helpful when interpreted against a goal line, which is the optimal trajectory for student improvement over time. You and your staff will want to establish criteria for setting individual goals for students. One potential criterion to use is end-of-year grade-level goals, and you can chart student growth over time against those benchmarks. Another option is to chart a goal line based on expected rates of improvement, or norms for student growth (National Center on Response to Intervention, 2012). Many commercially available intervention programs can help create goal lines and chart student growth over time. Regardless of the method, you and your team will need to ensure that staff is evaluating progress monitoring data against specific goals set for student improvement, as you see in the graph below.
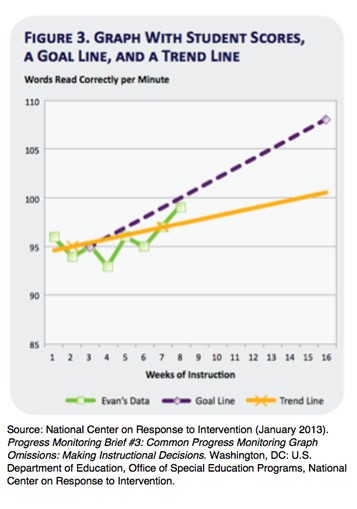
In this graph, the goal line is the dashed purple line. The student's progress monitoring data is plotted in green, and the yellow trend line is calculated using those data points. The trend line shows the estimated trajectory of progress based on the actual performance on progress monitoring assessments. The slope of the trend line is positive—going up—which shows that the student is indeed making progress in the targeted skill. The slope is not as steep as the goal line, however: the trend line is flatter. This indicates that the student is not making progress as rapidly as desired and may not reach the performance goal within the given time period. It is important to know that the slope of secondary students' progress may not be as steep as that of elementary students (Fuchs, Fuchs, Hosp, & Jenkins, 2001). This is the primary reason it is important to identify students with needs at the start of the school year and provide them with intervention services as soon as possible.
Understanding concepts such as trend, slope, and goal lines is important to getting a valid picture of students' progress in reaching targeted goals for intervention. This practice also allows you to compare different interventions and determine the most effective one based on the improvement trends in each. The decisions based on this analysis will be discussed in more detail in Part 3. You and your team will need to determine the level of staff support needed in understanding these practices and identify key staff to take on leadership roles in ensuring this knowledge is shared. You may review the brief Common Progress Monitoring Graph Omissions: Missing Goal and Goal Line and the RTI Implementer Series, Module 2: Progress Monitoring Training Manual, available on the Center on Response to Intervention site, for further guidance on these topics.

TO LEARN MORE: There are many sources of information about monitoring students' progress toward targeted literacy goals for students in secondary grades. Here are some of the best sites for research and resources:
Within the extensive website of the Center for Response to Intervention is a section dedicated to progress monitoring. Online modules and articles, several cited in this lesson, can be accessed from the Featured Resources bar.
A section of the RTI Action Network website is dedicated to progress monitoring and includes various resources and practitioner-focused articles.
The Intervention Central website provides teachers, schools, and districts with free resources to help struggling learners and implement response to intervention. The ChartDog Graph Maker is a tool that allows you to enter progress monitoring data and chart results.