Graphing Linear Inequalities
Let's look more closely at Ashley's situation. We can define x as the number of hours she spends practicing the clarinet each week and define y as the number of hours she spends working each week.
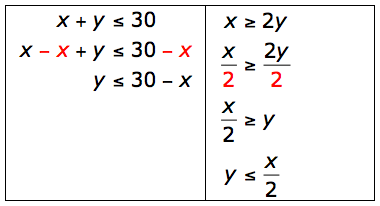
First, we know that Ashley cannot use more than a total of 30 hours for both activities each week. We can use the inequality x + y ≤ 30 to represent this constraint.
We also know that Ashley wants to practice the clarinet at least twice as many hours as she is working each week. We can use the inequality x ≥ 2y to represent this constraint.
Before you can use the graphing utility to show both of the inequalities, you must solve both equations for y.
Graph both inequalities in the graphing utility. (Note: you may have to adjust your window.)
- Use a semi-colon to separate the functions.
- Press the SET FUNCTION button.
- Choose the appropriate inequality symbol for each.
Multi-Function Data Flyer
Notice that the graph is divided into four color-coded sections.
- The blue shaded area represents points that would make the blue inequality true.
- The red shaded area represents points that would make the red inequality true.
- The purple shaded area represents points that would make both inequalities true.
- The unshaded area (white) represents points that would make neither inequality true.